TEMPERATURE CONTROL 4 TUTORIAL
INTRODUCTION
In this tutorial, you will add an indicator that displays the number of iterations the loop has performed, add a wait function to slow the loop iterations down, replace the Temperature control with a random number function and replace the Thermometer indicator with a waveform graph.
- Open the Tutorial 3.vi and Save as 4.vi
- Add a Numeric Digital Indicator to Show Loop Iterations
- Add a Wait MS Function to the Loop
- Replace the Temperature Control with a Random Number Function
- Replace the Thermometer Indicator with a Waveform Chart
- Run the VI and Observe the Results
- Save the VI and Exit Labview
OPEN TUTRIAL 3.VI AND SAVE AS
Open tutorial_3.vi and Save As to tutorial_4.vi
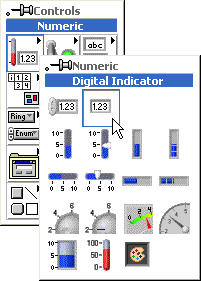
ADD A NUMERIC DIGITAL INDICATOR TO SHOW LOOP ITERATIONS
Add a Numeric Digital Indicator to the Front Panel and rename its label to Iterations
Place it above the On/Off switch
Wire it to the Iteration Terminal on the Block Diagram
Your Control Panel and Block Diagram should look like this:
RUN THE VI AND OBSERVE THE RESULTS
Flip on the On/Off switch and run the VI
You should observe the iterations in the Iterations indicator on the Front Panel
Notice that the iterations are counting up very fast
Stop the VI with the On/Off Switch
ADD A WAIT MS FUNCTION TO LOOP
Add a Functions > Time and Dialogue > Wait (ms) function to the Block Diagram
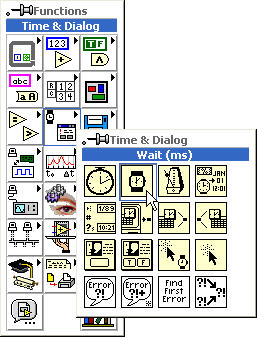
Place it to the right of the Greater? function
Add a Functions > Numeric > Numeric Constant to the Block Diagram and enter 500 in it
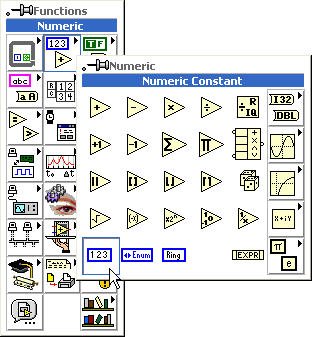
Wire the Numeric Constant to the left (input) side of the Wait (ms) function
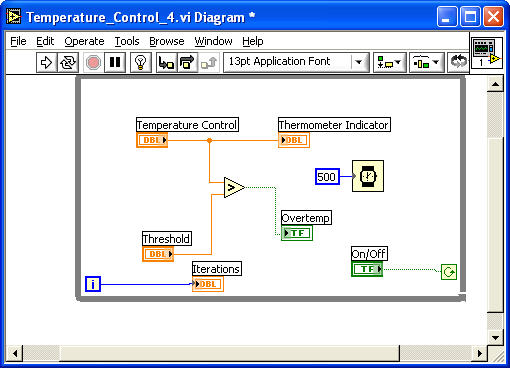
Your Block Diagram should look like this:
RUN THE VI AND OBSERVE THE RESULTS
Toggle On/Off switch to On and run the VI
The Iteration indicator should be counting every half second
Toggle the On/Off switch to Off
REPLACE THE TEMPERATURE CONTROL WITH A RANDOM NUMBER FUNCTION
Delete the Temperature control from the Front Panel
This should remove its terminal from the Block Diagram
Delete any bad wires
Add a Functions > Numeric > Multiply function to the Block Diagram; place it where the Temperature control terminal was
Add a Functions > Numeric > Random Number (0-1) to the Block Diagram; place it to the upper-left of the Random Number (0-1) function
Add a Functions > Numeric > Numeric Constant to the Block Diagram and enter 100 in the Numeric Constant's terminal; place it to the lower-left of the Random Number (0-1) function
Wire the added functions together
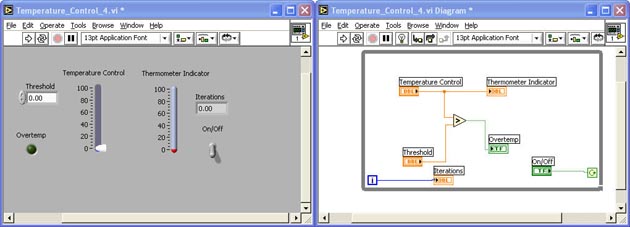
Your Front Panel and Block Diagram should look something like this:
RUN THE VI AND OBSERVE THE RESULTS
Change the Threshold indicator to 50 (if it isn't already)
Toggle On/Off switch to On and run the VI
You should see the Thermometer indicator varying temperatures between 0 and 100 degrees every half second
Toggle the On/Off switch to Off
REPLACE THERMOMETER INDICATOR WITH A WAVEFORM GRAPH
Select (with window select) the Threshold control and Overtemp indicator and move them to the left
Select (with window select) the On/Off switch and Iteration indicator and move them to the right
Note: This is just to make more room for the Waveform Graph
Delete the Thermometer indicator from the Front Panel and delete any bad wires from the Block Diagram
The Thermometer indicator's terminal should also be deleted from the Block Diagram
Add a Control > Graph > Waveform Chart to the Front Panel
Modify the Waveform Chart's Y axis to range from 0 to 100
Wire the Waveform Chart's terminal to the output of the Multiply function on the Block Diagram
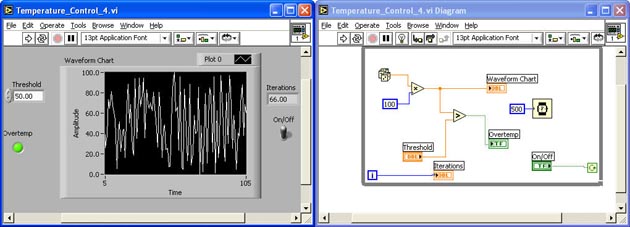
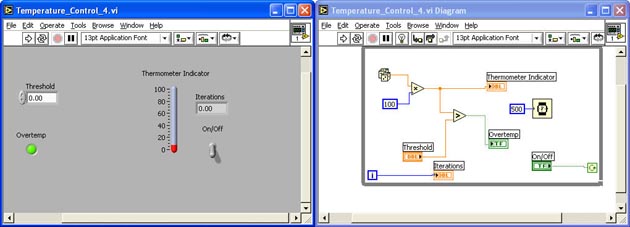
Your Front Panel and Block Diagram should look like this:

RUN THE VI AND OBSERVE THE RESULTS
Change the Threshold indicator to 50 (if it isn't already)
Toggle On/Off switch to On and run the VI
You should see the Waveform Chart indicator plotting a temperature between 0 and 100 degrees every half second
The Overtemp indicator should be indicating an Overtemp about half the time
Toggle the On/Off switch to Off
SAVE THE VI AND EXIT LABVIEW
|