What's in a Front Panel
The Front Panel is a window where you create your virtual instruments. Typically, this is where the user interacts with the program by entering data and viewing results. It is called the Front Panel because it is supposed to look like the front panel of an instrument or a group of instruments.
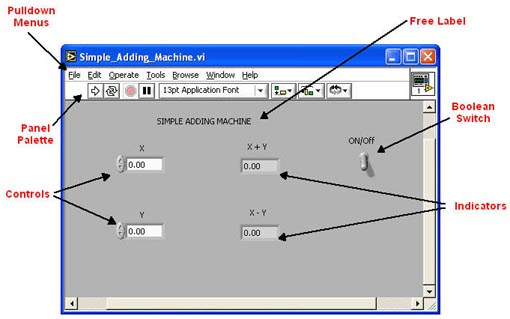
The Front Panel virtual instruments generally come in two primary forms: user inputs called controls and the program outputs called indicators. As mentioned, there are many types of controls and indicators. The Front Panel also includes nonfunctioning items such as free labels and decorations.
Data is generally inputted to a VI program through a control and processed data is output by a display on one or more indicators. Finally, the Front Panel has pull down menus and the Panel Palette which contains menu icons. We will cover them contextually throughout the modules.
Below is an example of the front panel for a simple adding machine VI
Accessing the Controls Palette in the Front Panel
In order to place controls and indicators on the Front Panel, you need to access the Controls Palette. You do this by right-clicking in the Front Panel Window. This is a common practice in Labview to access many Labview functions and is called "popping up".
When you do this, you get the Controls Palette:
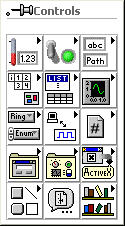
We will study the individual controls and indicators in context throughout the module
The Block Diagram
The Block Diagram is a window where the graphical code is created. This is the "programming" that replaces text syntax in traditional programming languages. A completed Block Diagram is populated with many types of icon-based nodes.
The first nodes that are created usually are the icons that represent the controls and indicators on the Front Panel called control and indicator terminals. There are also nodes that represent functions (like add, subtract, compare, constants and boolean switches to name a few), and program execution structures (like while loops, for loops and case and sequence structures).
All of these are wired together for logical functioning of the program. All nodes have one or more input and/or output terminals called connectors to wire to and from.
The Block Diagram window also has pull down menus and a panel palette which contains menu icons. We will cover them contextually throughout the modules.
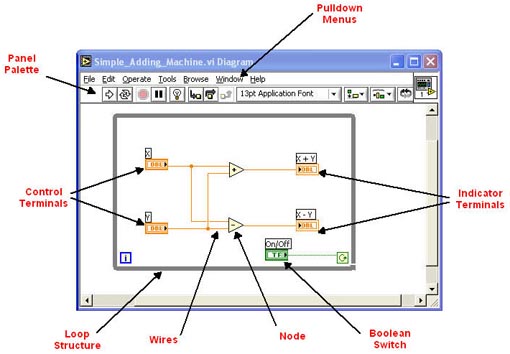
Below is an example of the Block Diagram for the same simple adding machine VI mentioned above:
Data Flow
Labview utilizes what is called data flow, where a Block Diagram node will only execute its function after it has received data from the previous node. After the node is through with its function, the processed data is transferred via a wire to the next node all the way across the Block Diagram eventually to the indicator node(s).
For example, in the above Simple Calculator Block Diagram, the add and subtract nodes will not perform their function until data is fully received from both control terminals on the left. After they have performed their function that data is passed on to the indicators on the right.
Accessing the Functions Palette in the Block Diagram
In order to place functions on the Block Diagram, you need to access the Functions Palette You do this by right-clicking (popping up) in the Block Diagram Window. When you do this, you get the Controls Palette:
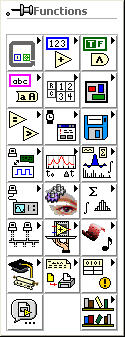
We will study many, if not most of the Block Diagram functions in context throughout the modules.
Popping-Up on Controls and Indicators
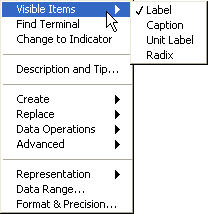
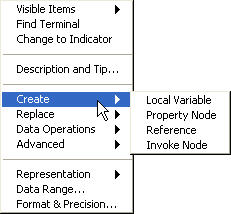
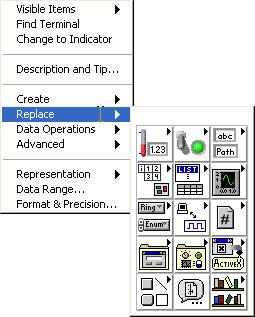
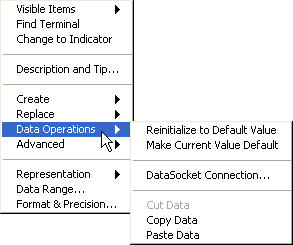
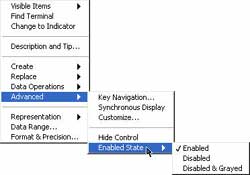
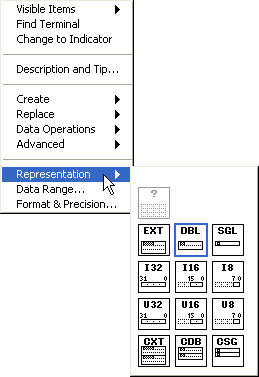
If you pop-up on a Control or Indicator on the Front Panel or on their terminals on the Block Diagram, you will get a convenient menu with many commonly-used items:
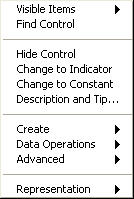
When you select a menu item with an arrow, sub-menus will pop-out.
Just do a quick study of all these menu items for now. The most commonly used and important munu items will be discussed in later modules:
The Tool Palette
There is a third window that is small, but important, called the Tools Palette. It is used to manage, modify, and debug VI's .
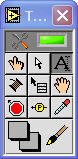
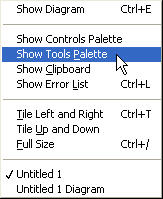
The Tools Palette is usually visible by default. If it is not you can access it by clicking on Window (Pulldown) on either the Front Panel or the Block Diagram > Show Tools Palette:
Listed below are the individual tools. They are listed in the order they are used the most
 |
Automatic Tool Selection - Automatically selects between the Operate Value, Position/Size/Select, Edit Text and Connect Wire Tools. It is the most commonly Selected item on the Tools Palette. |
 |
Operate Value - Manipulates the values of Front Panel Controls and Indicators. Generally selected while running a VI. |
 |
Position/Size/Select - Selects objects in a VI, moves them and resizes them. |
 |
Edit Text - Creates Free Labels on the Front Panel and edits their text. Also edits text in Owned Labels. |
 |
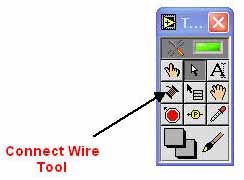
Connect Wire - Wires Block Diagram nodes and objects together. |
 |
Object Shortcut Menu - Displays an object's pop-up menu with the left mouse button. |
 |
Scroll Window - Pans the content on a VI window without using the window's scroll bars. |
 |
Set/Clear Breakpoint - Create breakpoints in a VI Block Diagram for debugging purposes. Breakpoints cause the VI to suspend execution at a particular point. |
 |
Probe Data - Places Probes on wires in the Block Diagram for debugging purposes. A Probe displays the data on a wire where it is placed. |
 |
Get Color - Copies colors from VI objects to pasting with the Set Color Tool. |
 |
Set Color - Colors objects in a VI and displays the foreground and background colors of the object. |
Wiring
Creating Wires
As mentioned, Block Diagram nodes are wired together for logical functioning of the VI. Block Diagram nodes have one or more input and/or output terminals called connectors to wire to and from. Wires are data flow paths between Block Diagram components.
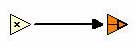
To create wires, select the Connect Wire tool on the tools palette (Usually, you can leave the tools palette in automatic selection).
With the wiring tool selected, when you bring your cursor close to a node connector hot spots will appear on both the node's connectors and the Connect Wire tool which means a wire will "Snap" to that connector.
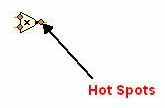
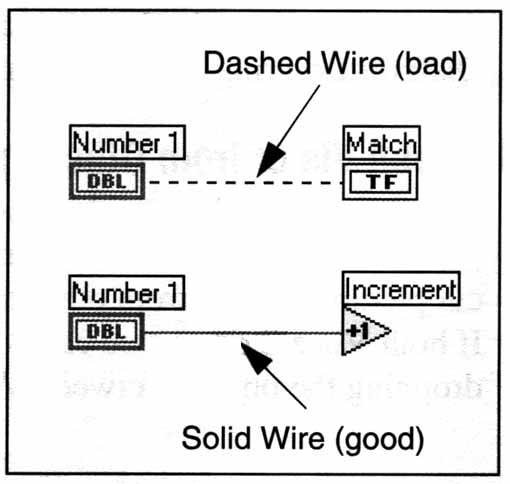
Once the wire snaps to the connector a dashed line will appear and you move the cursor to the corresponding connector on another component's connector. Watch the following animation as it goes through this process:
Animation 1: Creating a connection between components
 |
Wire Stretching
If you move a wired node on the Block Diagram, the wires will stretch to follow the node
Animation 2: Stretching wires
 |
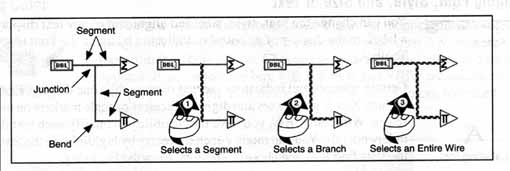
Selecting Wires
How many wires you select depends on how many times you left-click on a wire.
The first click selects a segment, the second click selects a branch, the third click selects the entire wire.
Bad wires should either be removed or the Block Diagram components should be corrected so that the wiring is logical to the VI. You can delete bad wires individually by selecting them and hitting delete or you can delete all bad wires by selecting CTL- B on your keyboard.