Sample Excel data & FFT (use to give you an idea of where to get started): impulse LRC(.xls) another LCR Excel example
Opitional: Doing Mathematica FFTs:(FFT)
Preview to lecture on 'what is a Fast Fourier Transform: (Slides), (data slides)
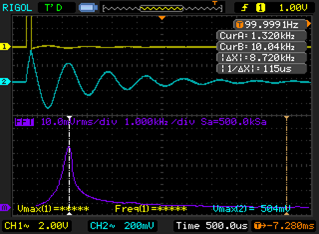
Sample output of trace:
TRY FFTs ON YOUR OWN!
How to load Excel secret FFT function. Please use with caution [Microsoft does not trust you].
1st: you must install the Data Analysis toolpack in excel, Instruction video: https://www.youtube.com/watch?v=mtmrAXwLcuU
1) Get Equipments; one half of the team can start exploring the FT of the square and trinangle waves while the other half sets up the LRC circuitt
2) Get a .csv file of:
- a square wave
- a triangle wave
- the LRC impulse response accross a resistor (make sure you choose the correct range)
Try to start your fourier analysis of all waveforms before finishing. Note the oscilloscope will show you the FT. You are required to FT analysis of amplitude only (phase is optional and is applicable to the LRC output only)
3) Search for your Excel "data analysis" icon, if you do not have one you need to add the AnalysisToolPak under the Excel options menu (see us for help)
4) See the FFT Excel complete guide to get started with your Fourier analysis of the above .csv (or use program of your choice Mathematica, MatLab, etc.).